
How to Leverage Analytics for Website Optimization
When it comes to website optimization, guesswork simply doesn’t cut it. Businesses that rely on hunches often waste time and resources making changes that don’t move the needle. Analytics removes that uncertainty by showing exactly how visitors interact with your site, where they drop off, and what motivates them to convert. With the right insights, you can make data-driven improvements that boost performance, increase conversions, and create a smoother user experience. At Decisive Design, we’ve seen firsthand how businesses transform their websites when they shift from intuition to analytics-driven decision-making. Let’s explore how you can do the same.
Why Analytics Is Critical to Website Success
Analytics doesn’t just measure activity; it uncovers the story behind your website. By showing how visitors interact with your pages, it transforms vague assumptions into clear, actionable insights. Here’s why that matters:
Turning Data Into Actionable Insights
Collecting data is only half the battle; the real value comes from turning raw numbers into insights you can act on. Instead of simply knowing that your site had 5,000 visitors last month, analytics can reveal which pages kept people engaged, which calls-to-action drove conversions, and where potential customers lost interest. This empowers you to make smarter decisions, like refining your homepage layout or improving product descriptions, with evidence to guide every move.
Avoiding “Gut-Based” Website Changes
Redesigning a website or tweaking elements based on instinct can be risky. Imagine reworking your homepage because it “looks outdated,” only to see conversions drop. Analytics protects against those costly mistakes. By showing you what’s working and what isn’t, data ensures your choices are strategic rather than speculative. The result is smarter investments and stronger returns.
Key Metrics That Guide Website Optimization
Analytics tools track a wide range of data points, but a few metrics are especially important when your goal is to improve website performance.
Bounce Rate and Exit Rate
Bounce rate measures the visitors who leave your site after viewing just one page, while exit rate shows where users most often leave during their journey. Together, these metrics highlight weak spots in your content or navigation. A high bounce rate on a landing page may suggest your messaging doesn’t align with user expectations, while a high exit rate on a checkout page may signal friction in the purchase process.
Time on Page and Scroll Depth
These metrics reveal how engaging your content truly is. If visitors spend very little time on a page or fail to scroll beyond the first section, it’s a clear sign your content isn’t holding attention. By tracking how long users stay and how far they scroll, you can refine layouts, add visuals, or restructure copy to make information easier to digest and more compelling to read.
Conversion Rate and Funnel Drop-Offs
Every website has a goal, whether it’s form submissions, sales, or downloads. The conversion rate shows how many visitors complete the desired action, while funnel analysis uncovers where potential customers drop off. For example, if you see a steep decline between adding items to a cart and completing checkout, analytics points directly to where your optimization efforts should focus.
Load Time and Core Web Vitals
Site speed directly affects both user experience and SEO rankings. Google’s Core Web Vitals track metrics like Largest Contentful Paint (LCP) and Cumulative Layout Shift (CLS), which measure how fast and stable your site feels to users. Even small improvements in load time can dramatically reduce abandonment rates and keep visitors engaged.
Traffic Sources and User Demographics
Knowing where your visitors come from and who they are allows you to tailor strategies more effectively. Analytics can reveal whether most of your traffic originates from organic search, paid ads, or social media. Demographic insights, such as location, age, or device type, enable you to fine-tune your messaging and design to better connect with your actual audience.
Best Analytics Tools for Website Optimization
Metrics are powerful, but you need the right tools to capture them. Here are some of the most widely used platforms for actionable website optimization.
Google Analytics 4 (GA4)
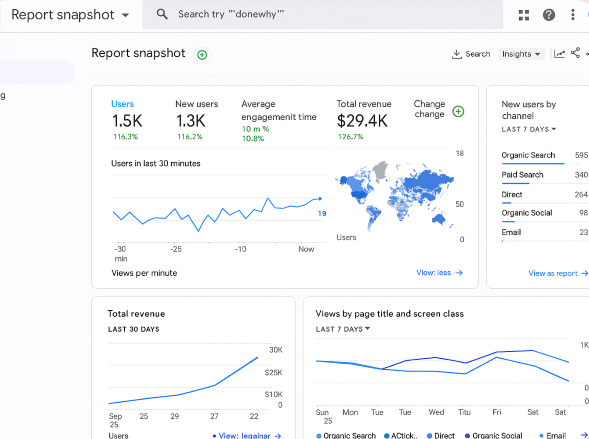
GA4 is the next generation of Google Analytics, designed with event-based tracking that goes beyond simple pageviews. It allows you to see how users interact with your site across devices and touchpoints. Dashboards highlight performance trends, conversion paths, and user engagement, making it easier to identify where optimization can deliver the greatest impact.
Hotjar or Microsoft Clarity
While GA4 tells you what’s happening, tools like Hotjar and Microsoft Clarity show you why. Heatmaps, session recordings, and click-tracking reveal how users navigate your site in real-time. For example, you might discover that visitors consistently ignore a button because it’s placed too far down the page. These visual insights are invaluable for refining layouts and navigation.
Google Search Console
Search Console focuses specifically on search performance and technical SEO. It shows which keywords drive traffic, how often your pages appear in search results, and whether there are errors impacting visibility. By monitoring this tool, you can resolve crawl issues, optimize content for high-performing keywords, and improve your site’s search presence.
A/B Testing Tools (e.g., Optimizely, VWO)
When you have a hypothesis about improving conversions, A/B testing tools let you validate it. For example, you might test two versions of a call-to-action button, headlines, or page layouts. With platforms like Optimizely or VWO, you can measure results in real time and confidently choose the version that drives better outcomes.
How to Use Analytics to Improve Website Elements
Once you’re equipped with the right tools and metrics, it’s time to apply analytics directly to specific areas of your site.
Optimizing Your Homepage
Your homepage is often the first impression users get. By analyzing bounce rate, click paths, and scroll heatmaps, you can see whether visitors are engaging with your main message or dropping off early. If most people don’t scroll past the hero section, for instance, you may need a clearer call-to-action or more compelling value proposition above the fold.
Fixing Underperforming Pages
Not all pages perform equally. Analytics identifies underperforming pages through low time on page, high exit rates, or poor conversion metrics. Once identified, you can experiment with changes like rewriting copy to be more engaging, adding stronger CTAs, or simplifying the layout. Testing new variations ensures you’re moving toward measurable improvements rather than arbitrary changes.
Enhancing the Conversion Funnel
The conversion funnel is often where revenue is won or lost. Analytics reveals where users drop off; whether it’s a confusing form, unclear product details, or extra steps in checkout. By addressing these pain points, such as streamlining forms or clarifying pricing, you can remove obstacles and create a smoother path to conversion.
Using Analytics to Improve User Experience (UX)
Improving user experience isn’t just about aesthetics; it’s about making your site intuitive and enjoyable to use. Analytics provides a roadmap for doing this effectively.
Mobile vs Desktop Behavior
Users interact differently depending on the device they’re using. Analytics helps you compare behaviors on desktop versus mobile, so you can tailor experiences accordingly. For instance, mobile visitors may need simplified navigation and larger buttons, while desktop users might prefer more detailed content layouts.
Identifying and Removing Friction Points
Analytics often uncovers the hidden reasons users leave: slow load times, hard-to-find menus, or unclear calls-to-action. By isolating these friction points, you can make targeted fixes that significantly improve the overall experience. Even small adjustments, like faster page loads or clearer navigation labels, can reduce frustration and keep visitors engaged.
Personalization Opportunities
One of the most exciting uses of analytics is tailoring content to individual user behavior. For example, if a visitor frequently views blog articles on a particular topic, you can recommend related resources. Personalized experiences not only improve satisfaction but also increase the likelihood of return visits and conversions.
Building a Data-Driven Optimization Workflow
To get lasting results, analytics needs to be part of a structured workflow rather than a one-off project.
Set Clear Goals Before You Analyze
Analytics is most powerful when tied to business objectives. For example, if your goal is to increase online sales by 20%, you can track conversions, funnel drop-offs, and campaign performance directly related to that goal.
Create a Testing Plan (CRO + UX)
Once goals are set, build a roadmap for testing changes. A/B testing and other experiments allow you to measure the impact of adjustments in both conversion optimization (CRO) and user experience (UX). This systematic approach prevents random changes and keeps your optimization efforts consistent.
Measure, Test, Repeat
Website optimization is an ongoing process. Analytics should be used in cycles: measure performance, test changes, analyze results, and repeat. Over time, this iterative process compounds into significant improvements in traffic, engagement, and conversions.
Make Analytics Part of Your Website’s Growth Strategy
At the end of the day, analytics isn’t just a nice-to-have; it’s a critical driver of business growth. By embracing data-driven decision-making, companies can save time, reduce wasted spend, and maximize ROI from their websites. At Decisive Design, we help clients turn complex analytics into clear strategies that fuel smarter design, improve user experiences, and achieve measurable results. When analytics becomes part of your growth strategy, your website stops being a static asset and starts becoming a true engine for success.
FAQs
How can I use analytics to improve my website?
Start by tracking core metrics like bounce rate, conversion rate, and traffic sources. Use these insights to identify problem areas, then make targeted changes and test the results.
What are the most important website metrics to track?
Key metrics include bounce rate, time on page, conversion rate, funnel drop-offs, load time, and traffic sources. Together, they provide a full picture of user behavior and performance.
Which tools help with website analytics?
Popular tools include Google Analytics 4, Hotjar, Microsoft Clarity, Google Search Console, and A/B testing platforms like Optimizely or VWO.
How does analytics impact conversion rates?
By revealing where users drop off or get stuck, analytics allows you to remove friction and streamline the conversion funnel. This directly improves conversion rates and ROI.
What’s the difference between GA4 and Universal Analytics?
GA4 uses event-based tracking, which provides more flexibility and cross-platform insights, whereas Universal Analytics was session-based and was phased out by Google.